Where is this scene actually spending my render? A Blender diagnostics suite
Adriano Muricy · 3D Generalist / Technical Artist
Personal project · Blender 5.1 · Cycles + OptiX, EEVEE, Vulkan backend
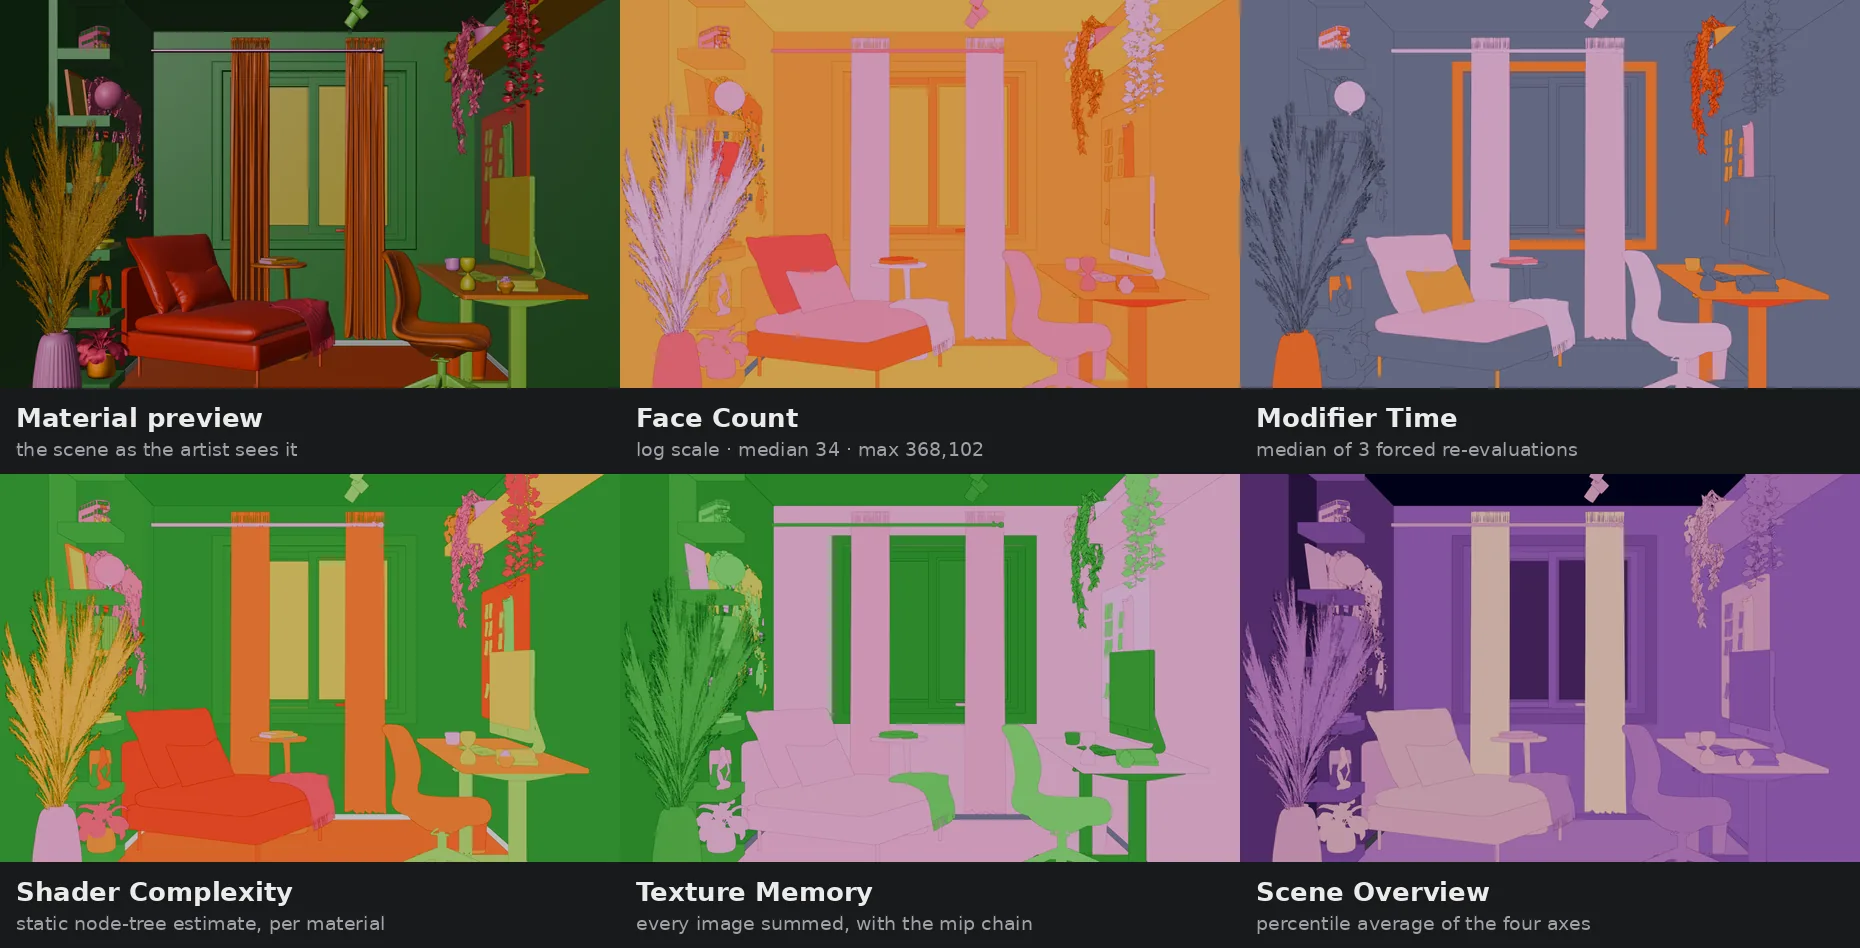
The same camera, six read-outs. Test scene: 1081 objects, 999 meshes, 3.05M faces (5.29M tris), 207 materials.
Summary
- The problem: "optimize the scene" is a task nobody can start, because nothing in Blender tells you which object is costing you. You end up decimating whatever looks heavy and hoping.
- The solution: a set of viewmodes that colour the scene by one axis at a time — face count, modifier evaluation time, texture memory, shader complexity — plus a combined overview and a VRAM budget report.
- The state: the diagnostics side is essentially done, with one quadrant documented as broken. The optimization side is two tools in and three ideas out.
The problem
A heavy interior scene takes minutes per frame and the only diagnosis you get from the software is "it's heavy". Blender has the numbers scattered everywhere — polygon counts in the statistics overlay, modifier timings in a tooltip, image sizes in the outliner — but never against the scene, never ranked, never in one place. So optimization becomes guessing, and guessing means people decimate the sofa because it looks complicated while a 368,000-face object sits off-camera doing nothing.
I built the thing I wanted: press a button, the scene repaints itself, the expensive objects are the red ones.
The view modes
Each mode is a separate addon sharing one colour ramp, one set of presets and one restore path. They all write to viewport display colour, so nothing about the render is touched — the scene goes back to normal with one click, and Ctrl+Z works.
Face Count
Polygon count per object, before or after modifiers, green to red. Sounds trivial. The interesting part is the scale: in this scene the median object has 34 faces and the biggest has 368,102. On a linear scale you paint 999 objects and see exactly one. So the default is logarithmic, with Rank and Value available:
- Rank — position in the sorted population. Immune to outliers, always readable, loses magnitude: 302 ms and 25 ms end up neighbours.
- Value — linear between min and max. Faithful to proportion, unreadable with a long tail.
- Log — equal ratios become equal distances. Cardinal like Value, readable like Rank.
Normalization is not a cosmetic detail. It decides what the user is able to see, and two mappings of the same data lead to different optimization decisions.
Modifier Time
Blender exposes modifier.execution_time, which looks like free profiling until you use it. Two traps stacked on top of each other.
First, the value is from the last evaluation. If the depsgraph evaluated that object lazily, you read garbage. An Ikea chair in this scene: 0.0 ms on a lazy read, 20–25 ms under forced re-evaluation. The Properties panel shows the first number. My heatmap shows the second. Both are "correct", they measure different things.
Second, a single run is noise — busy CPU, cold cache, evaluation order. So the mode forces re-evaluation and takes the median of N runs (default 3). On the whole scene:
| Dirty read | Median of 3 | |
|---|---|---|
| Total stack time | 5.9 s | 1.2 s |
| p95 | 17.9 ms | 3.35 ms |
The 5.9 s included cold file-loading times mixed with leftovers from old evaluations. That is not measurement, that is archaeology. With the rigour, the real ranking showed up: Wheels 302 ms, Vintage world globe 139 ms, Blanket 97 ms. The chair I was sure was the villain came sixth. Cost of the rigour: 1.6 s of baking.
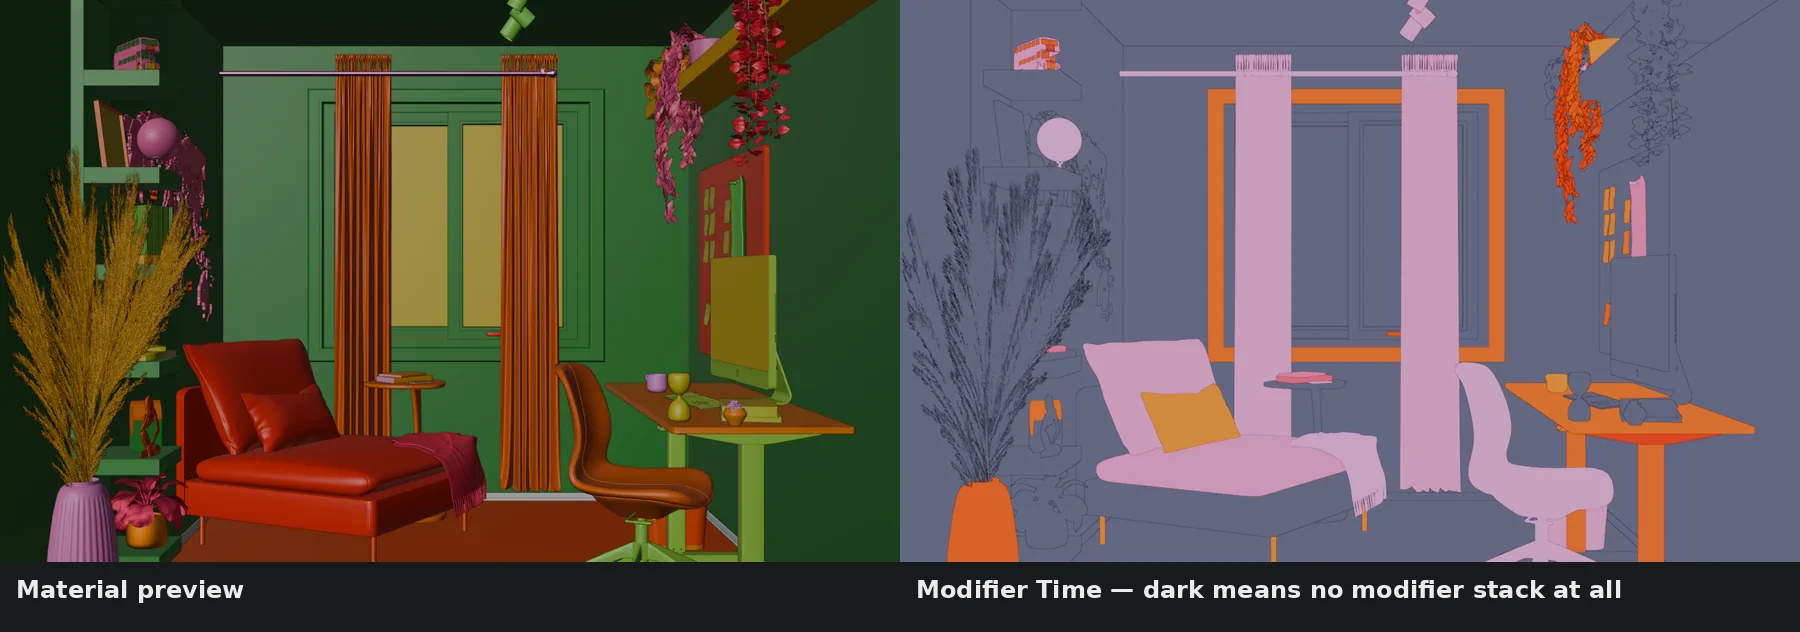
Dark blue means "no modifier stack at all" — in this scene that is 490 objects.
Texture Memory
Colours objects by the total texture memory their materials pull in, summing every image in the shader, not just the albedo: four 2K maps outweigh a single 6K one. Two modes, raw authoring footprint and GPU upload with the mipmap chain, because those are different numbers and people quote the wrong one.
This is a memory axis, not a shader-cost axis. An object with a cheap shader and heavy textures still burdens the render, and no shader-complexity mode will ever show it to you.
Shader Complexity
The one I spent the most time on, and the one that taught me the most.
I assumed Unreal's Shader Complexity viewmode was timing something. It is not: it counts instructions in the compiled shader, statically, once at compile time, and their own documentation admits the limitation — sixteen texture lookups are not sixteen maths instructions. The magic in the image comes from the second ingredient, accumulated overdraw: a translucent pixel costs the sum of everything behind it, which is why particles and glass blow out to white.
Then I went to see what Blender exposes in Python. Compiled GLSL and instruction counts: gone since 2.8. GPU timer queries: never existed. So the direct equivalent of Unreal's mode is impossible in pure Python — it needs C++, which means a custom build, which means nobody installs it.
What is possible is a static estimate from the node tree, weighted in SVM evaluation order, plus a measured probe on the Cycles side. Four quadrants, and the implementation swaps itself depending on the engine:
| Tab | Engine | How | State |
|---|---|---|---|
| Estimate | Cycles | node-tree weights | works, 0.05 s |
| Estimate | EEVEE | live viewport draw | broken |
| Measured | Cycles | adaptive sample-count probe | works |
| Measured | EEVEE | material override A/B, timed | inconclusive |
Scene Overview
The four axes are in incompatible units — faces, milliseconds, megabytes, instruction weights. The only unit they share is percentile within the population. So this mode normalizes each axis to its own percentile, averages them, and an object that pops on more axes climbs higher. It is a relative signal, not a cost number, and the panel says so.
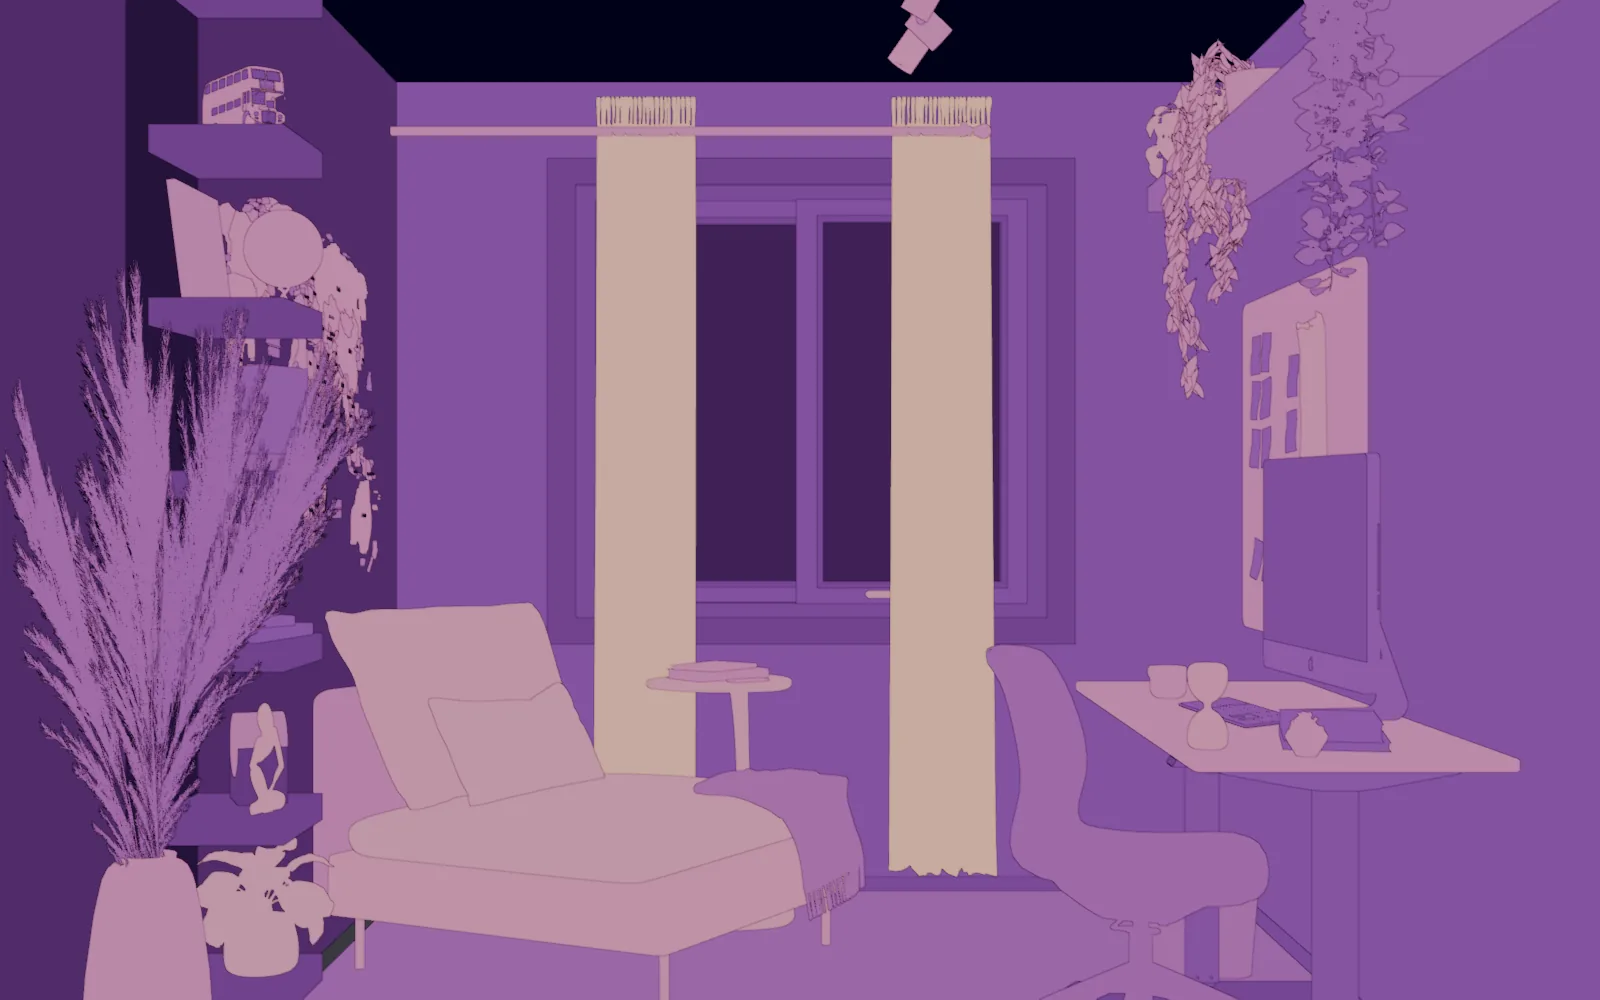
1077 objects, four axes averaged by percentile.
VRAM Budget Report
Not a heatmap — a text report, because some things are a list, not a picture. Textures, mesh batches and engine pools against what the card actually has:
## Total demand
  Textures            2.0 GB
  Mesh batches      272.3 MB
  Engine pools      642.0 MB
  --------------------------
  DEMAND              2.9 GB

  Card total          8.0 GB      Demand / capacity   37%
  Fits. If the viewport is still slow, the bottleneck is not memory.

## Reclaimable
  Utility maps at 4K+:                  0
  Greyscale wasting 3 of 4 channels:   53   pack RGB into one map to cut these to a third
  Unused datablocks:                    0
The line that matters is the last one. Fifty-three greyscale maps uploading three empty channels each, and a note in the report explaining that the file format is irrelevant here — JPEG, PNG and WebP all decode to raw pixels on upload. Only resolution and channel packing move that number.
Three things I got wrong on the way
The wall that looked expensive. The first thing the tool told me was that "White Paint", a nearly default Principled on a flat wall, was one of the most expensive materials in the scene. Obviously a bug. It was not. In a path tracer, pixel time is samples to converge × cost per sample, and the first term is dominated by lighting variance. A large smooth wall lit almost entirely by indirect light is exactly where the tracer struggles. Measured in EEVEE, those same four materials landed below the 10.7 ms noise floor — statistically indistinguishable from zero. Red in Cycles, green in EEVEE, same object.
That is not a contradiction, it is the most useful thing the suite produces:
| Static | Measured | Diagnosis |
|---|---|---|
| cheap | cheap | ignore |
| expensive | cheap | theoretical cost, low priority |
| expensive | expensive | optimize the material |
| cheap | expensive | the problem is the lighting, not the shader |
The flat red map. My Cycles probe came back 100% saturated, every pixel at 1.0. The instinct was to lower the adaptive threshold. Instead I ran the dumbest possible test: 4 fixed samples, adaptive off. If the Debug Sample Count pass were a raw count it would read 4.0. It read 1.0 — the pass is normalized, used over maximum. A flat map does not mean the threshold is loose, it means no pixel converged before the ceiling. The fix is counter-intuitive: raise the sample budget. At 512 the minimum dropped to 0.094 and the histogram filled out.
The ruler was lying. I was rasterizing geometry by hand into a GPUOffScreen to count screen coverage per material, and entire families of objects returned zero pixels. I checked frustum, culling, depth test, viewport, scissor, indices, matrices — all correct. The test that closed it was the stupidest one: same quad, same camera, only the scale changing.
| Scale | Expected | Got |
|---|---|---|
| 1× | ~5,700 px | 0 |
| 2× | ~23,000 px | 0 |
| 3× | ~51,000 px | 3,525 |
| 5× | ~142,000 px | 22,844 |
No rasterizer behaves like that. The backend is Vulkan on an RTX 3070, and my offscreen draw path is simply not reliable there — drawing straight into the viewport through a draw handler works perfectly on the same machine. Every number that path had produced was invalid, including a ranking I had already presented as a result. I threw it out.
That also fixed an architecture mistake. I had built the mode as a bake: measure per material, write colour, deal with which camera, cache invalidation, buffer read-back. Unreal's viewmode is not a bake, it is a shading mode — static cost per material, accumulated live on screen. Rewritten as a draw handler: geometry cache 11.4 s once, then 30.6 ms per frame drawing 5.29M triangles twice, and moving the camera recalculates nothing. Credit where it is due: I did not find that. The person I was building it for asked "can't the overdraw be realtime when the camera moves, isn't that how Unreal does it?".
What the tool refuses to tell you
A diagnostic tool has a responsibility a creation tool does not: it has to know when it doesn't know, and say so.
The EEVEE measured mode swaps each material for a zero-cost emission, re-renders and uses the delta as the material's real cost. Elegant, and useless as written: render.render() per material pays pipeline setup, shadow and GI updates and shader recompilation — seconds of fixed cost that swallow the material entirely. Three of four materials came back below the noise floor, and the largest was 8.5 s against ±4.9 s of variance.
The tempting move is to normalize anyway. The numbers exist, the ramp stretches any spread across the full range, the map comes out colourful and the user sees "information". That is when a measurement tool becomes a false-confidence generator, and somebody rejects a material because of a colour that was a coin toss.
So the panel computes the noise floor explicitly, reports how many materials fell below it, and when the noise exceeds the median it prints "result not conclusive" in red and paints nothing. The mode is labelled under revision until the method is rewritten. I lost a sellable feature and kept the only thing a diagnostic tool cannot lose.
The same honesty applies to the rest:
- Measured/Cycles is Cycles only, and it maps where the noise is — lighting and GI — not which shader is expensive.
- Modifier times are viewport evaluation, not render time.
- Face count does not yet count particle or collection instances.
- Nothing from the offscreen overdraw ranking is usable at all — it is an artifact of the Vulkan bug above.
Work in progress: the optimization side
Everything above only reads the scene. The other half applies fixes, which is a different quality bar entirely: it modifies the user's file, so it needs preview, reliable undo, and no batch action without confirmation. That is exactly why it is a separate bundle instead of a couple of extra buttons.
Two tools exist so far. Both keep the originals untouched and both are reversible.
Channel Pack — merges greyscale data maps into the RGB channels of a single image, losslessly, and rewires the shader to read the right channel. This is the fix for the 53 wasted-channel maps in the report above. What took the longest was not the packing, it was the refusals: the scan tells you in plain language why each map was rejected — has real colour in it, so it cannot share a slot (18), its Alpha output is plugged into something (1), 32-bit image, merging it would not save anything (5), the image file is missing (6), only one grey map in this material, needs at least two (34). A tool that silently skips half the scene is worse than one that does nothing.
Texture Downscale — reversibly downscales scene textures to fit a VRAM budget, with separate caps per map type (utility 1K, normal and colour 2K by default) and a plan you can preview before applying. Originals stay on disk; restore puts them back.
Not started, in the order I intend to do them:
- Reduce faces for top N — a Decimate applied to the N heaviest objects in the Face Count ranking. The ranking already exists, so the link to the diagnostics side is direct, and the demo is obvious. Open questions: modifier or applied, ratio versus face-count target, Collapse versus Planar, what to do with stacks that already have a Subsurf, how to preserve UV seams and boundaries.
- Automatic bake of procedural textures — the hardest of the three. Detecting which nodes are worth baking, resolution policy, objects with no UVs, which passes to bake and how to rebuild the Principled from them, and where to write the files without polluting the user's project. On a 1000-object scene a full bake is out of the question, so this will be selection-only.
- Keyframe optimization — F-Curve decimation within an error tolerance.
graph.decimatealready does the operation; the value would be choosing which curves and which tolerance automatically, and measuring the resulting visual error instead of the key count. It only makes sense after there is a way to measure what rig and animation cost in the first place, which is the one diagnostic axis I still have no model for.
Next steps on the diagnostics side
- Fix the live EEVEE cost view (z-fighting and alpha on the duplicated geometry).
- Rewrite the EEVEE measured mode around
draw_view3dwith warm-up and a robust quantile instead ofrender.renderper material. - Merge the five addons into one with the modes as tabs, and a lock-range option so two modes can share a scale.
- Clickable top-offender list in the summary panel.
- Instances in Face Count via
depsgraph.object_instances. - Multi-camera coverage for Measured/Cycles.
Tags: blender, python, addon development, profiling, rendering, gpu, tools, dataviz.